Ontario Election 2018 - Where Might the NDP Outperform?
June 05, 2018
Note this is not a left/centre/right/Conservative/Liberal/NDP partisan piece. I did my best to step back and assess the current race objectively.
Defining the Problem
With election day fast approaching I had to decide on a problem. One of the things that struck me was how Wynne vs. Horwath (the Liberal & NDP candidates respectively) match-up similarly to Clinton vs. Sanders. Wynne/Clinton lean more centrist/establishment whereas Horwath/Sanders are more left/anti-establishment. I decided to investigate what factors led a county in the United States to vote for Sanders over Clinton, and learn from this what ridings the NDP have a good chance of taking from the Liberals this election (as of writing the Liberals are expected to lose a number of seats to both the PCs and NDP).
Methodology
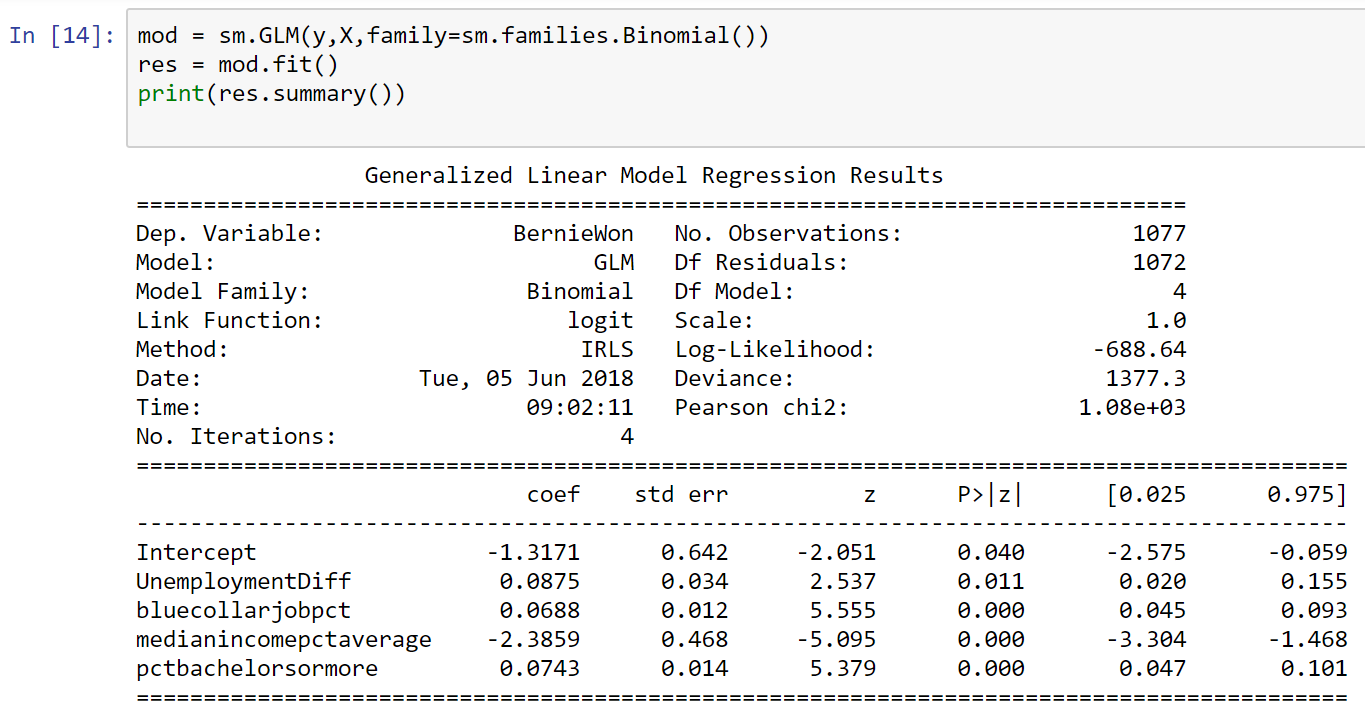
Towards this goal I created a simple logistic regression model to predict whether a county voted Clinton or Sanders during the 2016 Democratic primaries. To make the analysis transferable to Ontario I trained the model on states close in proximity to Ontario, plus some west coast states that are somewhat similar (NY/NJ were excluded since Clinton’s term as senator for NY could bias the model in those states).
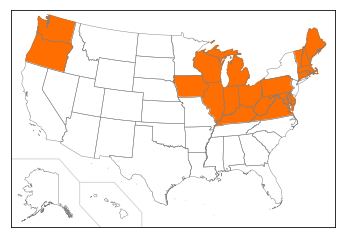
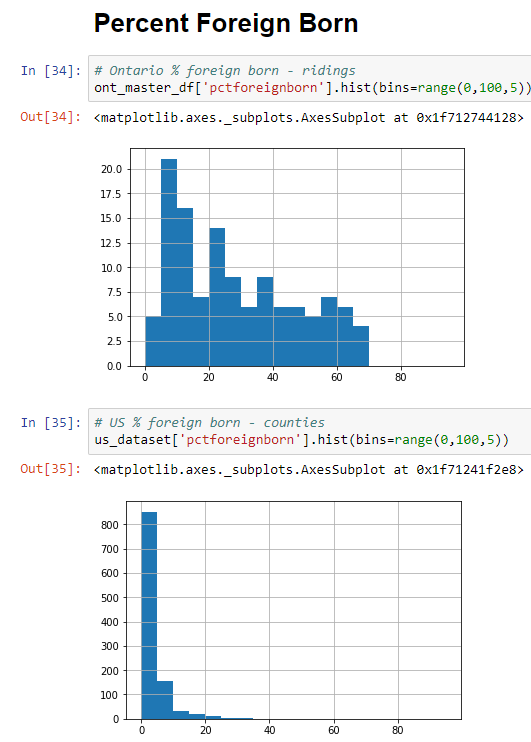
I ended up using exclusively economic predictor variables in this model (specifically unemployment rate in a county vs. national average, percent of jobs that are blue collar (by industry), median income as a ratio of average median income, and percent of individuals with a Bachelor’s degree or higher). I initially planned on using a immigration predictor, but ran into the issue of Ontario having a much higher proportion of its population being foreign born; in fear of extrapolating I decided to throw it away.
For the data I was able to get US Democratic primary results from OpenDataSoft, US county-level census data from the US Census Bureau’s American Fact Finder, and Canadian demographic data from StatsCan’s National Household Survey.
The Model
After training the model on US data, I then ran a hypothetical scenario. Assuming Ontario provincial ridings were in the US, based on my model, what was the probability they would have voted for Bernie Sanders. The intuition behind this is that if a riding shares characteristics with counties that were supportive of Bernie Sanders, it would not be too big of a stretch to think they could end up supporting the NDP this election.
Ridings to Watch
The model, based solely on economic factors, identified the following ridings as those the NDP could do well in vs. the Liberals.
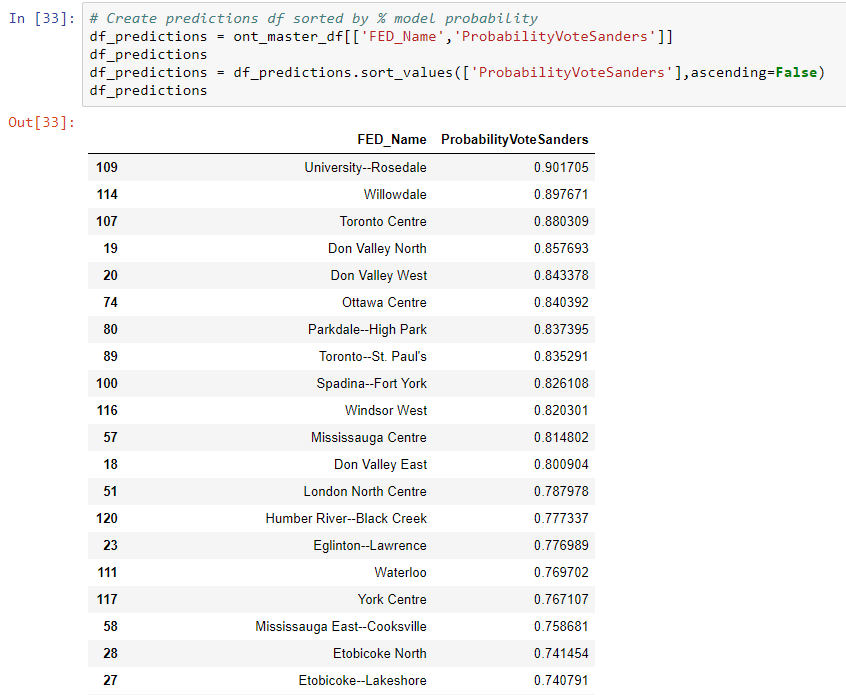
Given how the model is constructed, and how many factors are not included, it is best to use this as a preliminary screen. For example, the Liberal vs. NDP analysis is irrelevant in Etobicoke North (the riding is almost certainly going to elect Doug Ford who won ~80% of the mayoral vote in Etobicoke North in 2014).
Some Riding Predictions
I am not pretending to have a massive amount of confidence in these predictions, although they are a useful exercise in assessing this line of analysis after the election. Ridings I was less comfortable predicting were those where the NDP were distant 2nd/3rd place in the 2014 election; it seems even with the strength in the polls one has to go out on a limb to confidently predict those.
-
University–Rosedale/Toronto Centre/Spadina–Fort York: These three ridings represent what was previously just ‘Toronto Centre’. 2014 saw 46% Lib, 30% NDP, 13% PC. These score well in the model, and with the Liberals fading in the polls in Toronto, I believe an NDP sweep of these ridings is likely.
-
Willowdale: Despite scoring highly in the model, since 1987 the NDP has never placed better than 3rd, and 2014 saw 52% Lib, 33% PC, 10% NDP. I am less enthused with the NDP’s chances here.
-
Ottawa Centre: The riding has flipped between Liberal and NDP since its creation in 1967. 2014 saw 51% Lib, 20% NDP, 18% PC. This riding should be close, but I predict a NDP upset.
-
Parkdale–High Park: The NDP incumbent Cheri DiNovo is no longer running. 2014 saw 41% NDP, 40% Lib, 13% PC. I predict a NDP landslide victory.
-
Windsor West: NDP candidate Lisa Gretzky will win once again.
-
London North Centre: The NDP came second here in 2014, and are polling generally well in southwestern Ontario. 2014 saw 35% Lib, 30% NDP, 26% PC. This riding, which includes UWO, is a strong candidate for a NDP victory.
-
Waterloo: A new riding split out from the old Kitchener–Waterloo. Scores high on the model, NDP incumbent, plus contains two universities. Very strong NDP victory.
Process/Lessons
- When I first set out to do a data science project on the Ontario election I figured the data I would need would be relatively accessible, and I could spend most of my time conducting the analysis instead of data cleaning/manipulation/etc. In reality ~90% of the work was in getting the necessary data into pandas dataframes and then learning how to manipulate it into a format conducive for analysis. One time consuming task was cleaning the Democratic primary results; for some reason the results were broken down by county for some states and by municipality for others. Another frustration was working with the StatsCan National Household Survey CSV file where certain rows had the same row name but represented different values. With the election fast approaching I ended up having less time for the actual model building than what would have been ideal. A lesson for next project is to leave myself more time for data preparation.
- I also learned fairly late in the process that the StatsCan household survey data was somewhat stale, so for next time it will be important to be a bit more careful choosing data sources.
- This was one of my first times using pandas and some functions that came in handy were dataframe.merge(), dataframe.iterrows(), dataframe.shape, dataframe.unique()
Link to Github (code is in Ont2018ElectionModel.ipynb)
6/11/2018 Post-Election Update
In the election the PCs secured a majority and the Liberals only managed to win seven seats. I went perfect on my predictions of nine ridings, although I do so humbly given my predictions were relatively ‘safe’. I was happy that I overrode the model in Willowdale where the NDP finished third. Also I was happy with Ottawa Centre where initially I was hesitant to forecast the NDP would win given the large Liberal margin 2014. Also, I did not predict Don Valley East/West/North given I did not think my model captured all the dynamics at play there (especially in Wynne’s own riding); in retrospect that was the right decision.
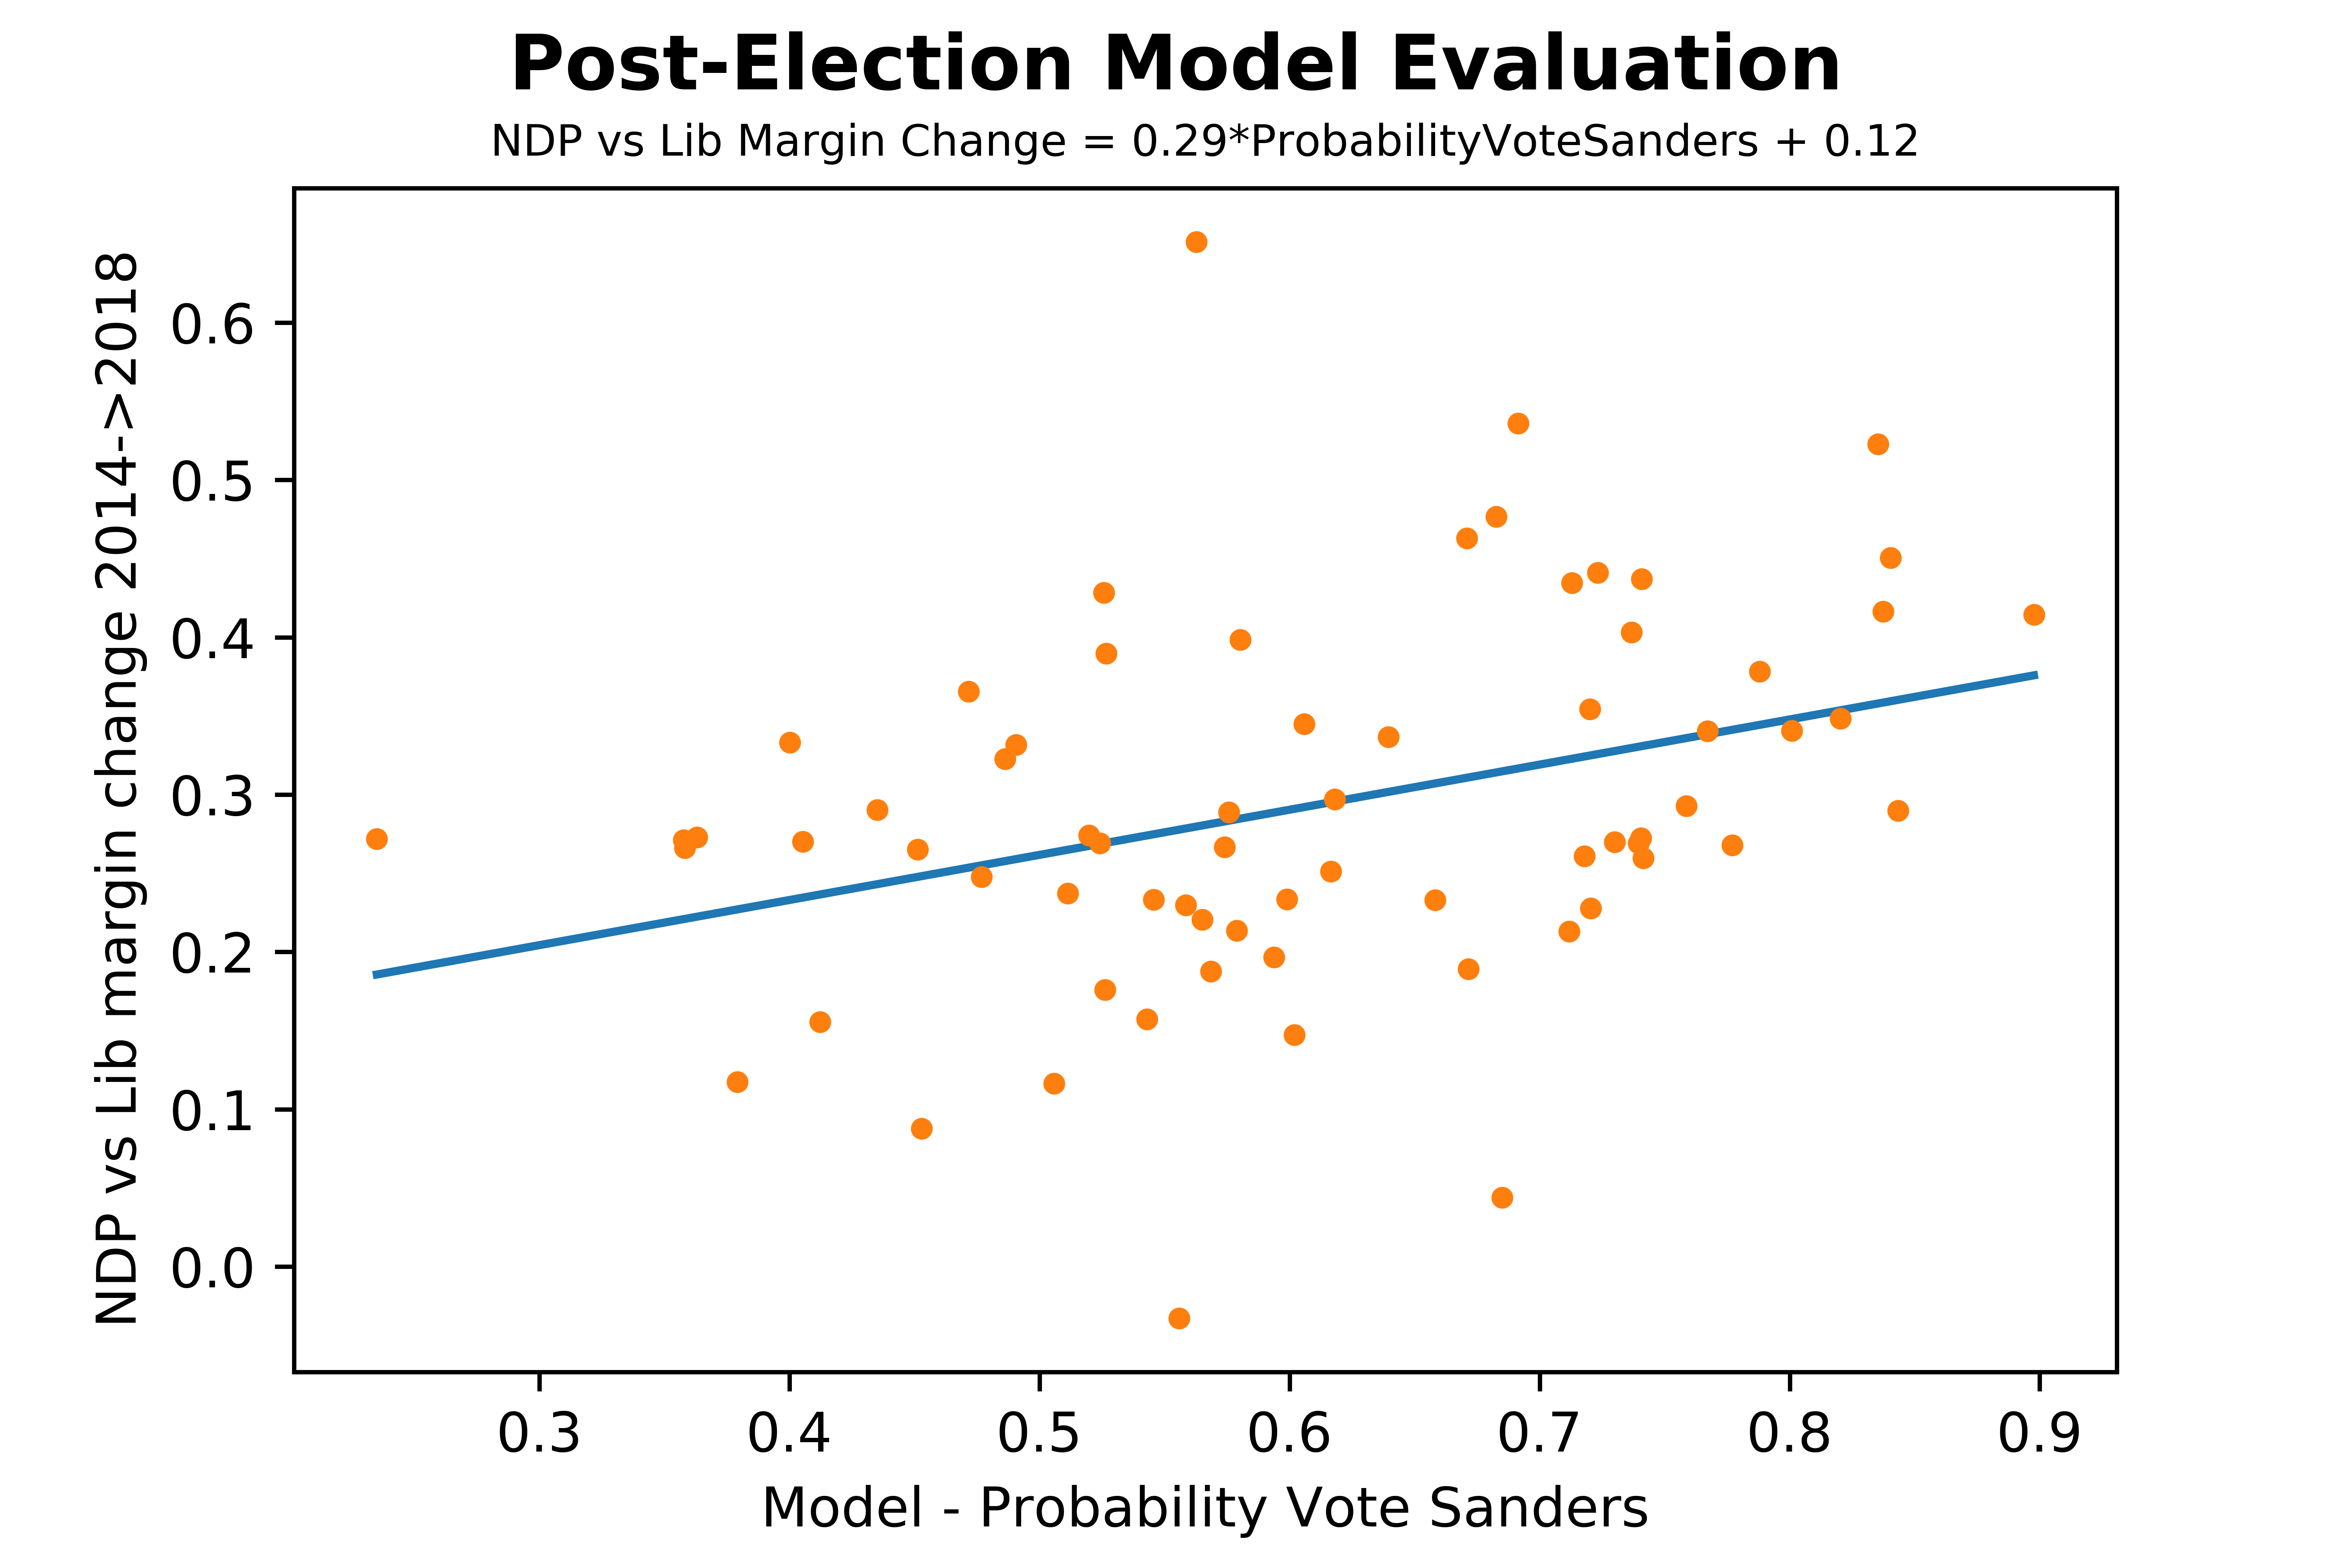
What I am most happy about is how the model seemed to fare overall. Of the ridings that were in existence in both 2014 & 2018 the model did seem to pickup features (reflected in high ProbabilityVoteSanders scores) that would help the NDP improve their vote count vs. the Liberals (chart below).
One lesson that was hammered home again in doing this post-election analysis was the rule that 90% of your time is data cleaning vs. 10% analysis. I was disappointed that a simple and clean breakdown of 2014 results was not accessible in CSV format from ElectionsOntario; and I was lucky a UofT prof posted the 2018 results in a nice format. Plus the redrawing of ridings meant I had to throw out some of the data given I was not able to get a clean 2014 vs. 2018 comparison. That being said, given my experience getting the data for the initial model, I had a better grasp of what was needed to get the data into the required format.
Overall I am happy with the results. Part numerical analysis, part common sense, and I was able to correctly predict some ridings. A good first attempt at political forecasting.