Fantasy Hockey 2018 Draft Resources Up on Github
October 21, 2018
Finally got the opportunity to upload some of the draft tools I used this year to Github. I used a combination of a PostgreSQL database full of player stats, and a Jupyter Notebook for data wrangling and visualization.
Two plots which I found quite helpful in my drafting:
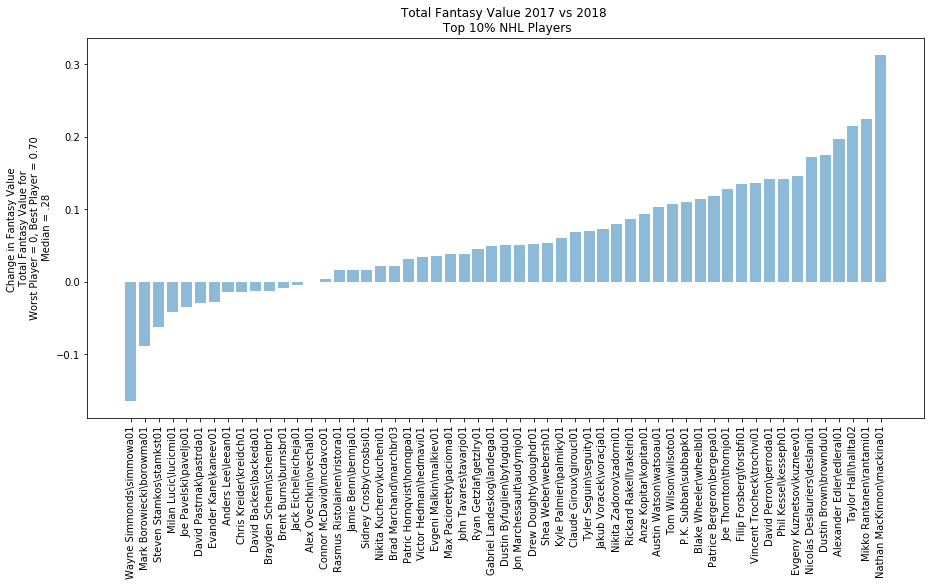
- This shows the 2017 vs 2018 relative performance of the top 10% of players in the league. Very helpful in identifying potential bargains, or overvalued players.
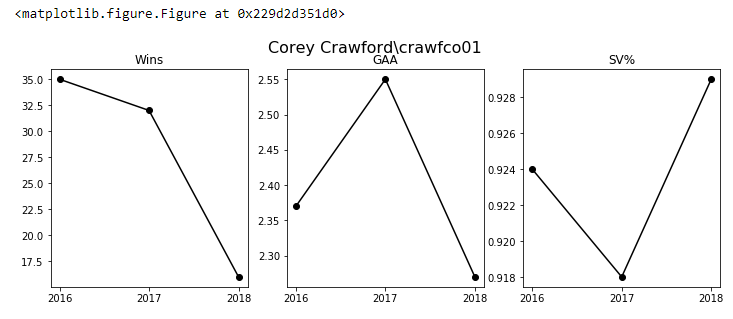
- For a given goalie this shows the past three years performance (W, GAA, SV%). This came in very helpful during the actual draft when I had to quickly compare multiple goalies.
In the past I largely used Excel to do this type of analysis. What I realized this year is that for any non-trivial type of data analysis like this, Python is much, much, much, easier to use.