2018 UofT Data Science Student Challenge
March 12, 2018
Last weekend I participated in the UofT Data Science Student Challenge. This was the second data science case competition I have participated in, the first being the Citadel Datathon in January. Another great experience which I learnt a lot from.
The Competition
The case was released Saturday afternoon and presentations were Sunday afternoon. The dataset used was actually the same as in the Citadel Datathon (Geotab vehicle data). Essentially we were to use the data to come up with a solution to an urban planning or transportation problem.
I was on a team with two Physics PhD students, one of which I met at the Citadel challenge. Since this was not my first data science case competition, I felt I was able to contribute much more to my team than at the Citadel Datathon. This was especially true in the early stages of the competition where we were mostly doing data cleaning and manipulation. My growing knowledge of R (dataframes in particular) came in handy.
Our Solution
Our team focused on solving the problem of where to locate gas stations. One of the datasets contained information about the location, popularity, and some other features of ~3000 gas stations in Ontario. We were able to combine this information with two other datasets about traffic flow and dangerous driving areas to come up with a predictive model (below is the second slide of our presentation outlining the essence of what we came up with).
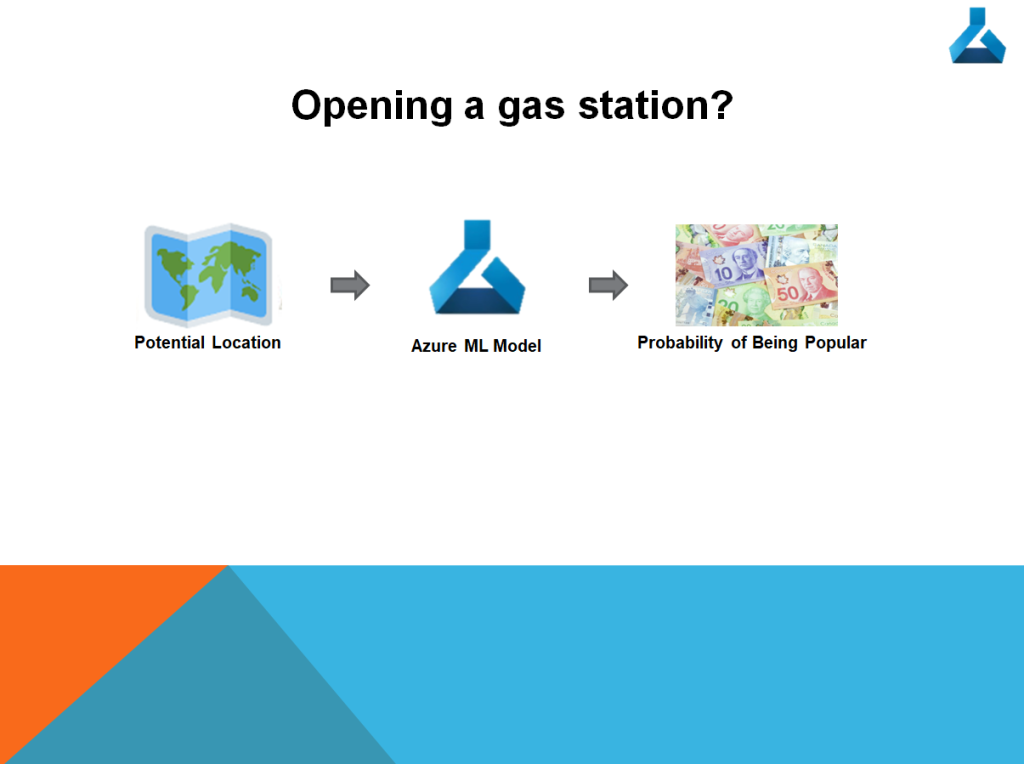
I am still relatively new to machine learning models so our final model came from my teammates who built a Two-Class Boosted Decision Tree in Microsoft Azure ML Studio, and a Anomaly Detection model in R. I chipped in with a logistic regression model, which despite its relative simplicity, actually arrived at many of the same conclusions.
Mapping
For each fuel station we were given its location, and a number of features. Given the Geospatial nature of the dataset I had to become familiar with maps in R. I was actually surprised with how quick and easy it was to create professional looking maps using the ggmap package. Part of what made it so simple is that ggmap interfaces with Google Maps so you only need to provide latitude/longitude points for your data and it will automatically pull a map which encompasses all of your datapoints. From there you can adjust colour/size of your points based on certain attributes (in our case the popularity of a certain gas station). During the weekend I only scratched the surface of R’s mapping functionality, but developed a sense of how powerful it is.
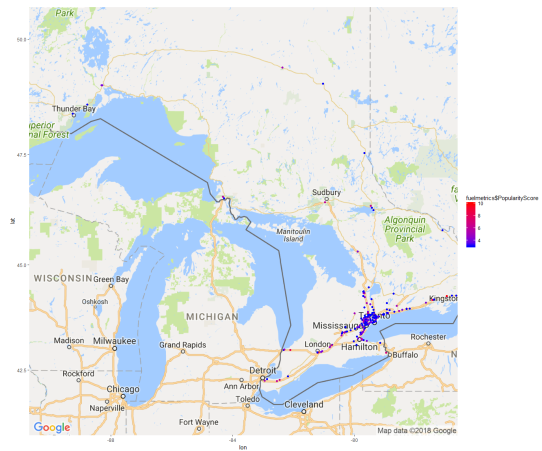
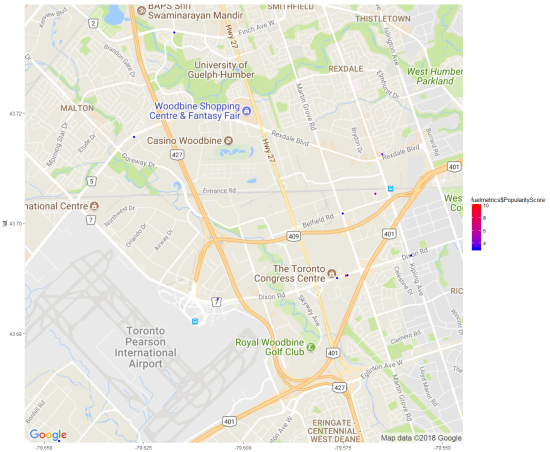
Maps of gas stations in Ontario by popularity (top), zoomed in segment (bottom)
Lesson 1
Given the competition was sponsored by Microsoft, it was unsurprising that a portion of the judging went towards how well the team used Microsoft Azure ML Studio in their solution. This meant that a non-negligible amount of time was spent trying to figure out how to use Azure ML Studio. On one hand this was a great experience because I was able to gain familiarity with a development environment which is actually used in industry. On the other hand, given the compressed timeline I wish I could have spent more time doing the actual data analysis part of the competition as opposed to learning new technology. This has taught me a broader lesson for these type of case competitions that whenever possible try to avoid having to learn things on the fly because this will eat up lots of time.
Lesson 2
Having gained some data analysis experience this year in class and attending these case competitions, I have begun to appreciate how critical good judgement is for conducting data analysis. Particularly the importance of asking the right questions.
One of the most time consuming aspects of data science case competitions is the data cleaning/manipulation stage. Given this takes up so much time it is very important to focus your analysis properly from the very start so you do not end up wasting time pursuing avenues of investigation which do not yield anything. Sometimes it is easy to quickly check the correlation of two variables in your dataset. Other times, especially when there is significant data manipulation or merging of datasets involved, doing something as simple as checking if two variables are positively correlated can take a lot of time. This makes it very important to be able to hypothesize about what some of the relationships in the data may be and using that as as starting point for your analysis. One could be the world’s best programmer/statistician but if you fail this initial step it is unlikely your analysis will yield anything.
The case competition was a great event. Special thanks to UofT, Microsoft, Geotab, and the DCSIL for organizing.